Into the last quarter of 2026

The core question for Q4 is simple: can earnings growth outrun a higher hurdle rate
It's important to pay close attention to S&P, NASDAQ and in particularly, AI valuations. With long term yields sustained above 5% (the previous anchor), oil prices still elevated since the war in Iran.
I believe much of investors' concerns is shifting towards what is the measuring yardstick of AI monetisation? The story that AI Capex is well in our minds, higher capex, lower cash flow; it's an old story. This is why earnings in Q4 is coming back to the center.
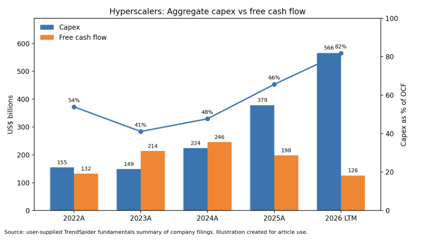
AI remains a powerful theme, but higher capital intensity means the market increasingly has to distinguish between companies that can fund the buildout from durable cash generation and those for which the investment burden is becoming much heavier.
My baseline is constructive, but not complacent: September improved the starting point. Q4 still has supportive flows and seasonality, but the market now needs earnings evidence rather than another round of valuation expansion.
“Part of the reason to say they’re magnificent is because they made magnificent amounts of cash and didn’t spend any of it. That’s why they were magnificent.”
“Now… they’re spending a trillion plus a year on AI capex and they’re negative cash flow to the tune of… 200 billion.”
“Three four years ago, they were making 300 billion in free cash flow. Now… next year it’ll be minus 200 billion.”
“They have to be kind of subservient to the bond market.”
With depleting balance sheet capacity, the economics of the current AI buildout are becoming more exposed to the price of money in two ways.
- Long term yields
- since the long term yield is a major benchmark for the cost of capital across the economy
- as long term yield rises, the risk-free return rises, hence investors demand a higher return from equities
- therefore future cash flows are discounted more heavily and P/E multiples gets punished
- at the same time, borrowing becomes more expensive, so companies funding data centers, chips, power and infrastructure face a higher financing hurdle
- Credit spreads
- is simply the extra yield investors demand to lend to a company instead of lending to the US govt.
- corproate borrowing cost = treasury yield + credit spread
- given the risk investors have taken on to finance AI builtout, they demand a greater required return on investment, due to the perception of risk
- therefore the marginal data-center / infrastructure projects become less attractive causing capex to slow and earnings assumptions may be revised down and cooling of equity valuations
Anyway that was a longwinded appraoch to explain the current situation.
Reviewing the 2026 YTD - September was much of a reset. Here is why?
The bullish Q4 case starts with a technical reset. This is not just a narrative. Several measurable sources of excess moved materially lower during September.
- Systematics: Citadel Securities estimates US equity CTA* positioning fell from +2.35 standard deviations at the end of August to -0.80 by September 29, which is a move of more than three standard deviations in one month. Positioning moved below neutral and into the bottom fifth of its range since 2024.
- Retail: September cash turnover fell to 0.94x its trailing one-year average, the lowest level of 2026 and 26% below the June peak. Retail options premium also fell to 0.94x its one-year average from 1.41x in June (roughly one-third lower).
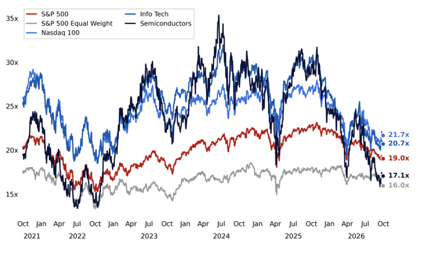
- Valuations: Citadel places the Nasdaq 100 at roughly 21.7x forward earnings, 14% below its 2026 valuation high. The IT sector multiple is down about 21%, while semiconductor valuations are down roughly 31%. Goldman separately describes Nasdaq multiple compression of about 20% this year.
- Corporate demand: US companies had authorised roughly $1.3 trillion of repurchases through September 29, a record for that point in the year. As earnings are released and blackout windows reopen, that authorised capital becomes a potential source of demand.
What does this mean?
Several large marginal buyers now have more capacity to return. CTAs can rebuild exposure if price trends improve; corporates regain access to buyback windows; and retail enters October from a much cooler participation base than it had in June.
But, do they still have the appetite to reset. I would love to hear more about this.
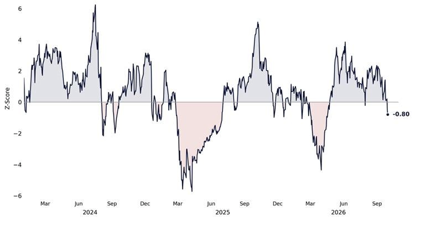
A cleaner technical setup does not mean the market is broadly healthy. The strongest counterargument to complacency is breadth. At the end of September, the S&P 500 was only around 2% below ATH, yet only about 25% of constituents were above their 50-day MA.
"The S&P 500 is increasingly not the average stock."
Sometimes, I like to take direct quotes, because they simply illustrate the situation instead of over-explanation.
That matters because a cap-weighted index can remain strong while the median company weakens. As mega-cap technology becomes a larger share of the benchmark, passive inflows mechanically allocate more dollars to the same leaders. Concentration is not itself a sell signal, but it raises the sensitivity of the index to a smaller number of earnings outcomes.
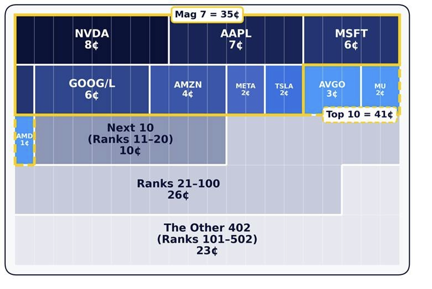
The Q4 Equation: Earnings Growth vs. Multiple Compression
This is the central framework for the article. Technology can keep rising in a high-rate environment, but the source of the return has to change.
The simplest valuation identity is:
Share Price = EPS × P/E Multiple
If the P/E multiple falls because the discount rate rises, earnings must grow enough to offset that compression merely to keep the share price unchanged. The required earnings growth can be written as:
Required EPS growth = 1 / (1 − multiple compression) − 1
This is not a full discounted-cash-flow model; it is a simple valuation bridge. But it makes the hurdle intuitive.
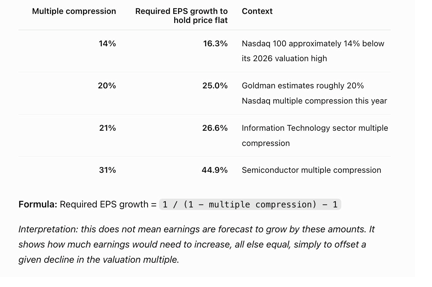
The implication:
- If the Nasdaq multiple has compressed about 20%, EPS needs to rise roughly 25% just to offset that valuation compression, all else equal, which is what “earnings doing the heavy lifting” means.
At the September 30 recording, Goldman Sachs Peter Callahan made the same point. He noted 10-year Treasury yields were north of 5.25% and that technology multiples had compressed about 20%, yet tech still generated strong returns because the AI theme and earnings growth remained intact. In other words, the market has already shifted from a multiple-expansion regime toward an earnings-delivery regime.
The question has changed from “How much are you spending?” to “What are you getting back?”
We are roughly three years or four years into the AI cycle. And investor conversation broadened beyond semiconductors and capex beta toward cybersecurity, data infrastructure, implementation tools, agentic commerce and consumer-facing personal assistants. The market is moving up the stack.
That makes the next earnings the first major test of the new phase. For AI-linked companies, I would focus on four measurable outputs:
- Return on invested capital: are returns rising alongside the enlarged capital base?
- AI-derived revenue: can management identify incremental revenue rather than only productivity anecdotes?
- Capex trajectory: is spending still accelerating, flattening, or beginning to generate operating leverage?
- Free cash flow: how much of the buildout is internally funded, and how much more sensitive has the thesis become to long-term yields?
As AI capabilities become cheaper and more widely available, value may increasingly accrue to the scarcer assets that make intelligence useful: proprietary data, trusted distribution, embedded workflows and businesses that can convert AI usage into durable cash generation.
In my opinion, software remains one of the areas of uncertainty, and therefore one of the more contrarian parts of the market. Cybersecurity, data infrastructure and workflow-enablement software may benefit if enterprises need help deploying and governing AI. But core SaaS is less clear: AI can improve the product while also pressuring pricing, shortening moats and making some applications easier to replicate.
The same uncertainty applies to the consumer-agent layer. Products such as Meta’s Muse and other OpenAI-style assistants point toward a future in which personal agents handle scheduling, search, shopping and execution. The capability is exciting, but trust remains unresolved. User discussion on X and elsewhere still suggests these tools are not yet consistently reliable enough to be delegated important tasks without supervision. That implies monetisation at the consumer-assistant layer may lag technical progress.
Lastly, it's mid-term elections. There are even more noise.
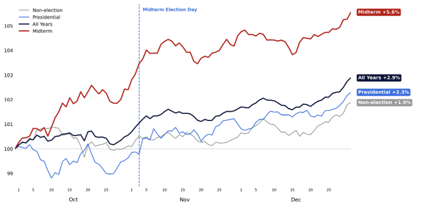
Since 1930, Citadel’s Bloomberg analysis shows the S&P 500 has gained an average 5.6% in Q4 during midterm years, versus 2.9% across all years. In midterm years, October and November have historically averaged +2.4% and +2.2% for the S&P 500; the Nasdaq 100 has averaged +3.9% and +4.9%.
The path is even more important: in 14 of 24 midterm years since 1930, or 58% of the sample, the Q4 closing low occurred in October. From that Q4 low, the median rally into year-end was about 10%.
My synthesised market take
Base case — constructive, but selective
- Long-term yields remain high but broadly stable rather than making another disorderly move higher.
- Q3 earnings validate continued earnings growth and begin to show measurable returns from AI investment.
- CTA exposure rebuilds from below-neutral levels and buyback windows reopen.
- The index can move higher, but dispersion remains high and breadth improves only gradually.
Bull case — the hurdle rate falls
- Long-term yields decline and oil moderates, relieving pressure on discount rates.
- AI monetisation data surprise positively: stronger revenue, productivity, margins, and ROIC.
- Valuations stop compressing while earnings continue to compound, allowing price gains to come from both EPS growth and some multiple stabilisation.
Bear case — earnings stay good, but not good enough
- The long end rises materially again, lifting the discount rate and forcing another round of multiple compression.
- AI capex remains very high but monetisation and cash returns fail to scale quickly enough.
- Concentrated index leadership becomes a vulnerability if a small number of mega-cap earnings disappoint.
- The result need not be an earnings recession: good earnings can still produce weak returns if the hurdle rate rises faster than earnings expectations.
What would change my views?
The long end
- If 10-year yields continue rising despite restrictive policy, I would treat that as a warning that financial conditions are tightening independently of the Fed. That would weaken the constructive case.
AI monetisation
- If earnings reveal limited incremental revenue, weak ROIC or deteriorating free cash flow against a still-rising capex base, the market will have less tolerance for premium valuations.
Breadth
- A concentrated rally can continue, but a healthier Q4 would eventually require the gap between the S&P 500 and the average stock to narrow.
Oil and inflation
- Persistently elevated energy prices would reduce the Fed’s flexibility and keep pressure on long-duration equity valuations.
Politics
- The November midterms introduce policy uncertainty around tax, regulation and fiscal direction. I would treat this as event risk.
Next in Direction: the market-level framework only tells us where to look. In the next article, I will take a few stab at a few individual companies, using reverse DCF, AI monetisation and cash-flow durability to separate businesses where expectations have genuinely reset from those where the valuation still assumes near-perfect execution.
References
https://www.goldmansachs.com/insights/the-markets/ai-is-becoming-a-stock-pickers-market
Disclaimer: This article does not constitute investment or trading advice. I am sharing my own analysis and synthesis of research, commentary and material I have read across multiple platforms, with sources and references provided throughout. It is for informational and educational purposes only.